Component Map
- Component Map
- Product
- SOC & DevSecOps
- Users
- ~2 months
- Timeline
- Me + 1 engineer
- Team
Project Overview
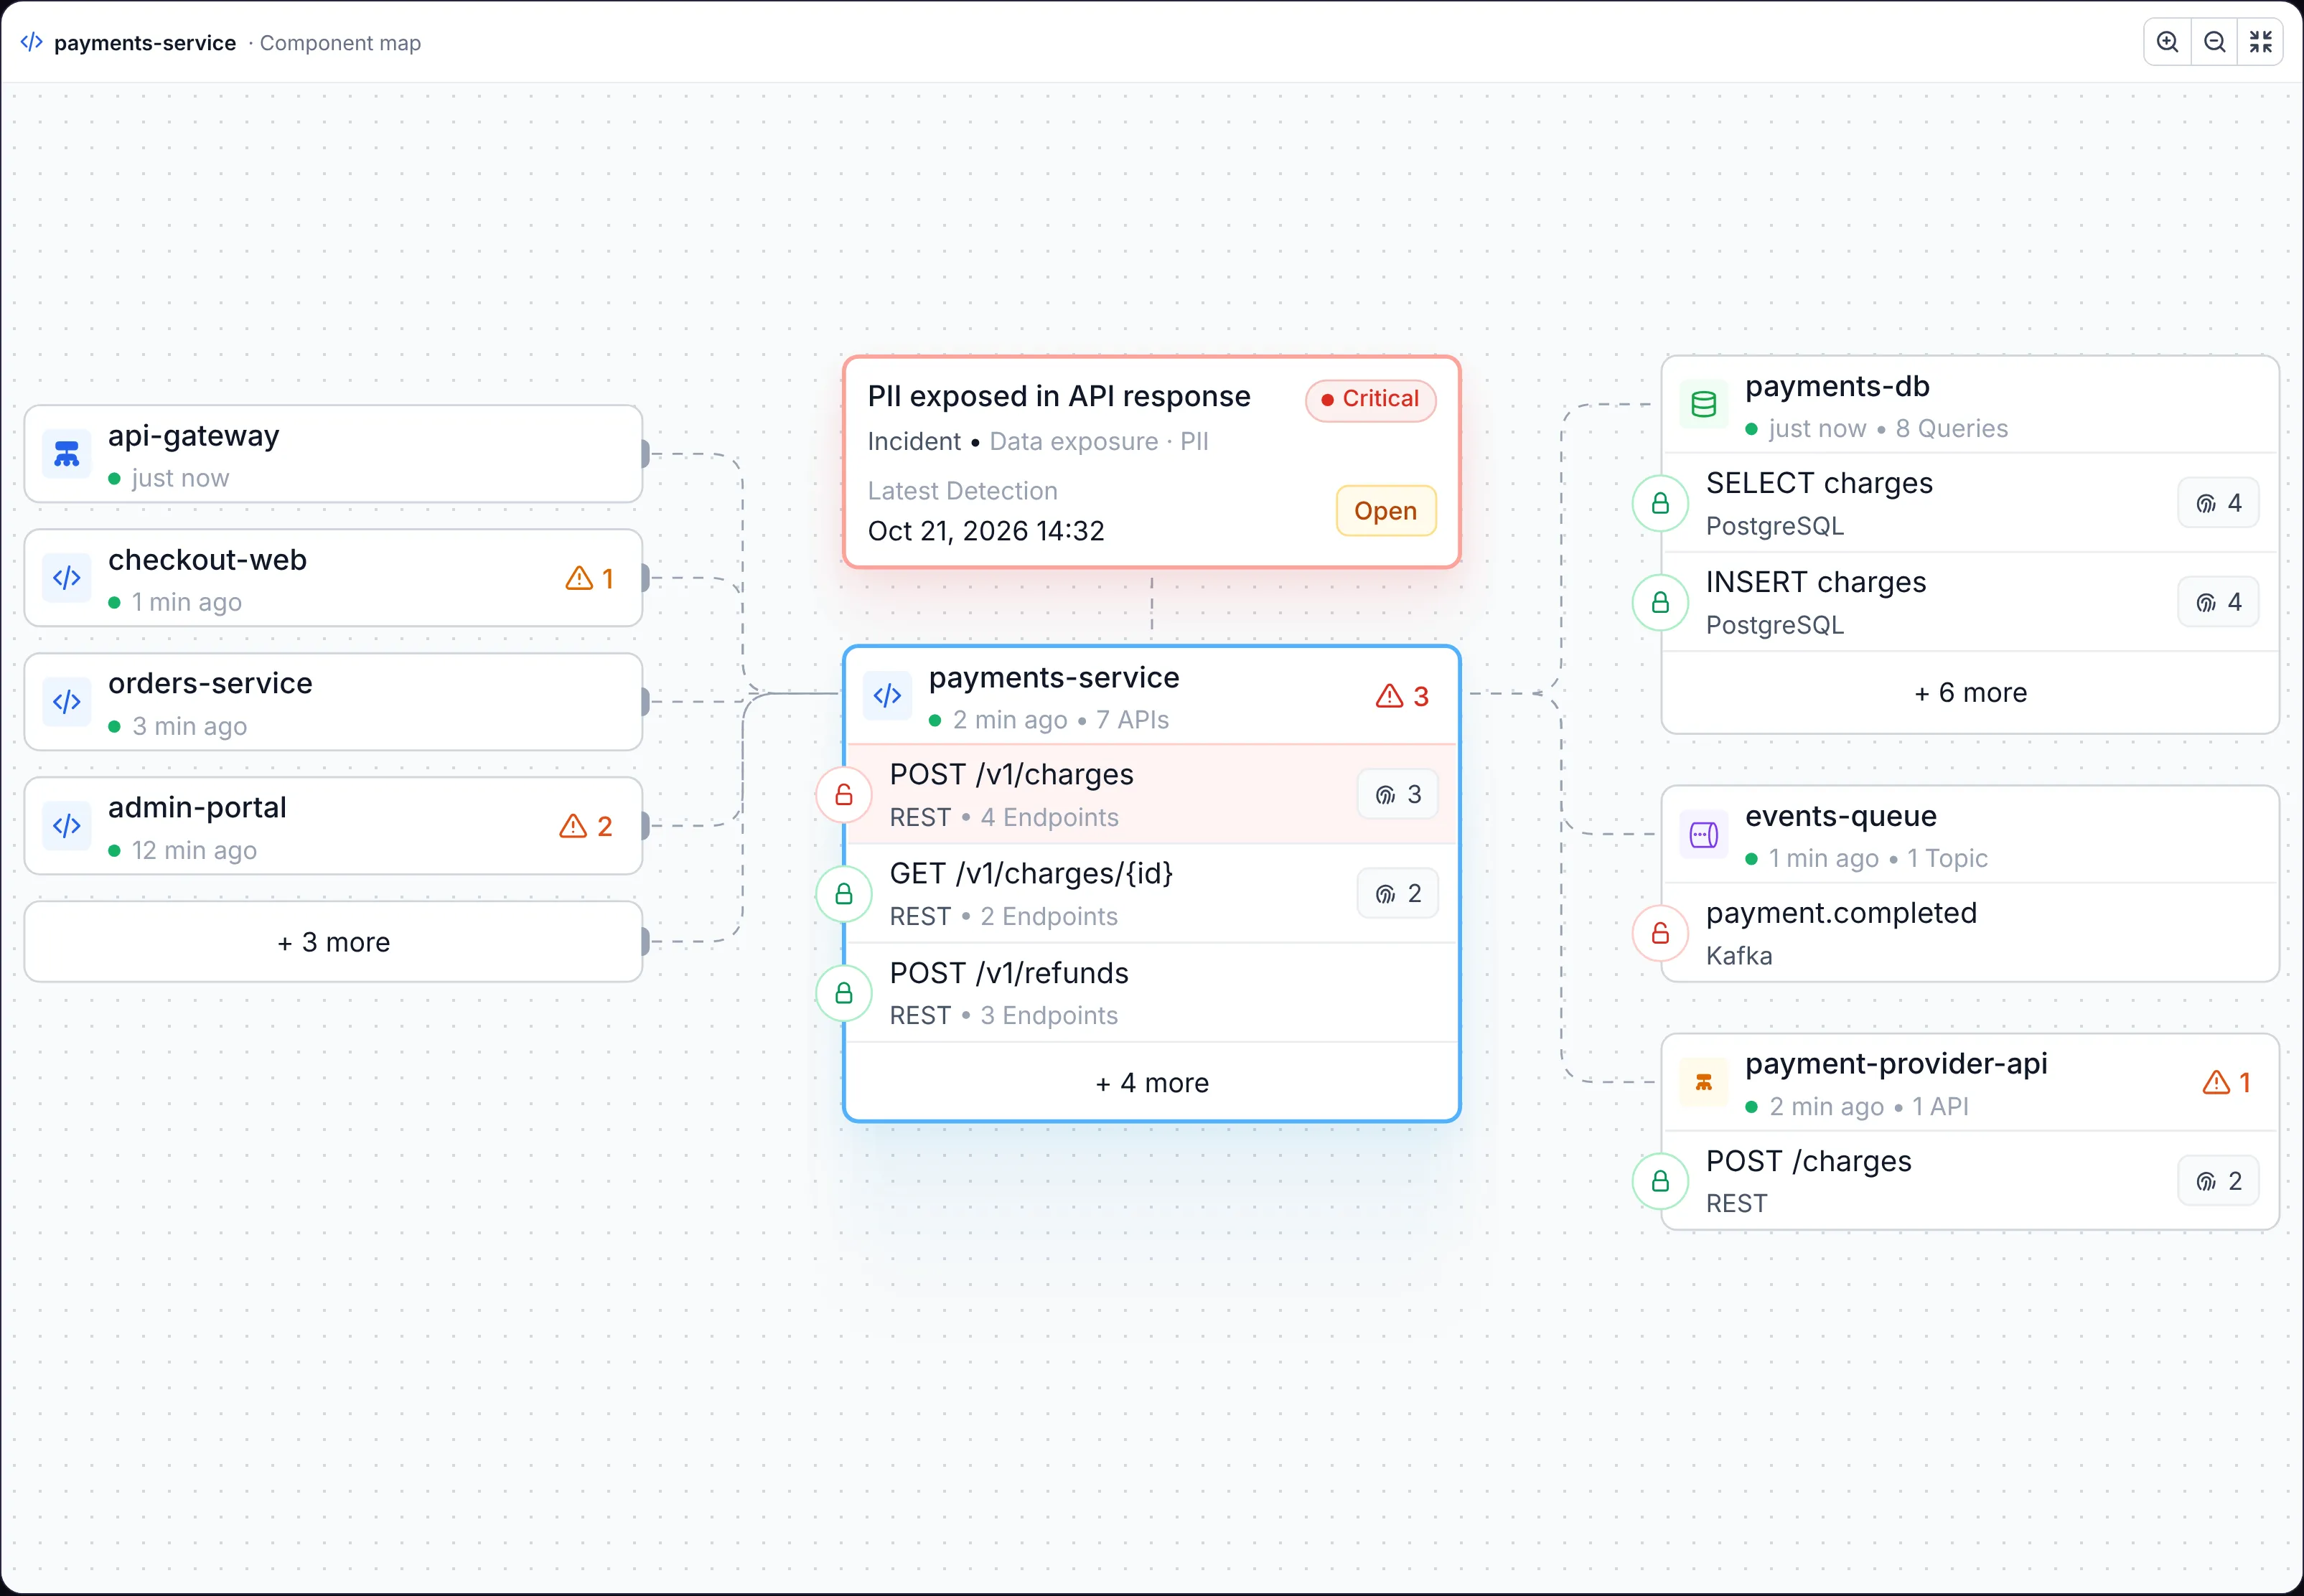
Each component in Alma has its own page, and the map sits at its centre. The component is in the middle with its APIs listed under it. On the left are the components that call it, on the right the databases, queues and services it calls, each with its own queries or topics. The open issue sits above the component, linked to the API where it was detected, so an analyst sees the issue, the data it touches and everything around it in one view.
Sole Product Designer
I was the product designer on it end to end, from the two maps to the anatomy of every node, working with one engineer for about two months.
Traffic we could see, but the customer couldn't
Alma monitored the customer's traffic and collected a detailed picture of how their services talk to each other. But that picture only lived in our data. Customers relied on Datadog and other table-based tools, where every row stood alone and the connections between components were simply not there. We needed a way to show what we saw, so a customer understands what their data is doing and where it goes.
- Before
- Tables in Datadog and other tools, no connections between components.
- What we had
- Every call between services, databases, queues and APIs, from monitored traffic.
- The gap
- No visual way for the customer to see that picture and trust it.
Two users, two maps
I worked with the people using it every day, SOC analysts and DevSecOps engineers, and found two different jobs.
One user browses the inventory to understand their own system: which services, databases and queues exist and how they connect. The other investigates a threat and needs to know which component it sits on and what that component reaches. So we built two maps: an inventory map of app items, and a threat map that starts from the issue and shows the component it leans on.
- Browse
- DevSecOps: see my app items and how they connect.
- Investigate
- SOC analysts: see the threat and everything it can reach.
Design Opportunity
How might we show a customer the traffic we monitor as a map they can read at a glance, whether they're exploring their system or chasing a threat through it?
Reading the map
The first version used nodes in the style of our security map, but they couldn't carry the detail people needed, so each node became a card: a service with its APIs stacked inside it. Icons replaced text wherever they could, and colour carries status: a green or red lock for encryption, a red row where an issue was detected. Long lists collapse into a "+ more" row for the extra app items connected to a service. The trade-off was clear: by stacking APIs inside their service, an API doesn't get a map of its own.
Building it with the engineer exposed a data problem. Kubernetes reported the same workloads several times, which created duplicate app items, and NGINX and load balancers appeared as services with dozens of APIs, when a service usually has one. We had to clean that up before the map could tell the truth.
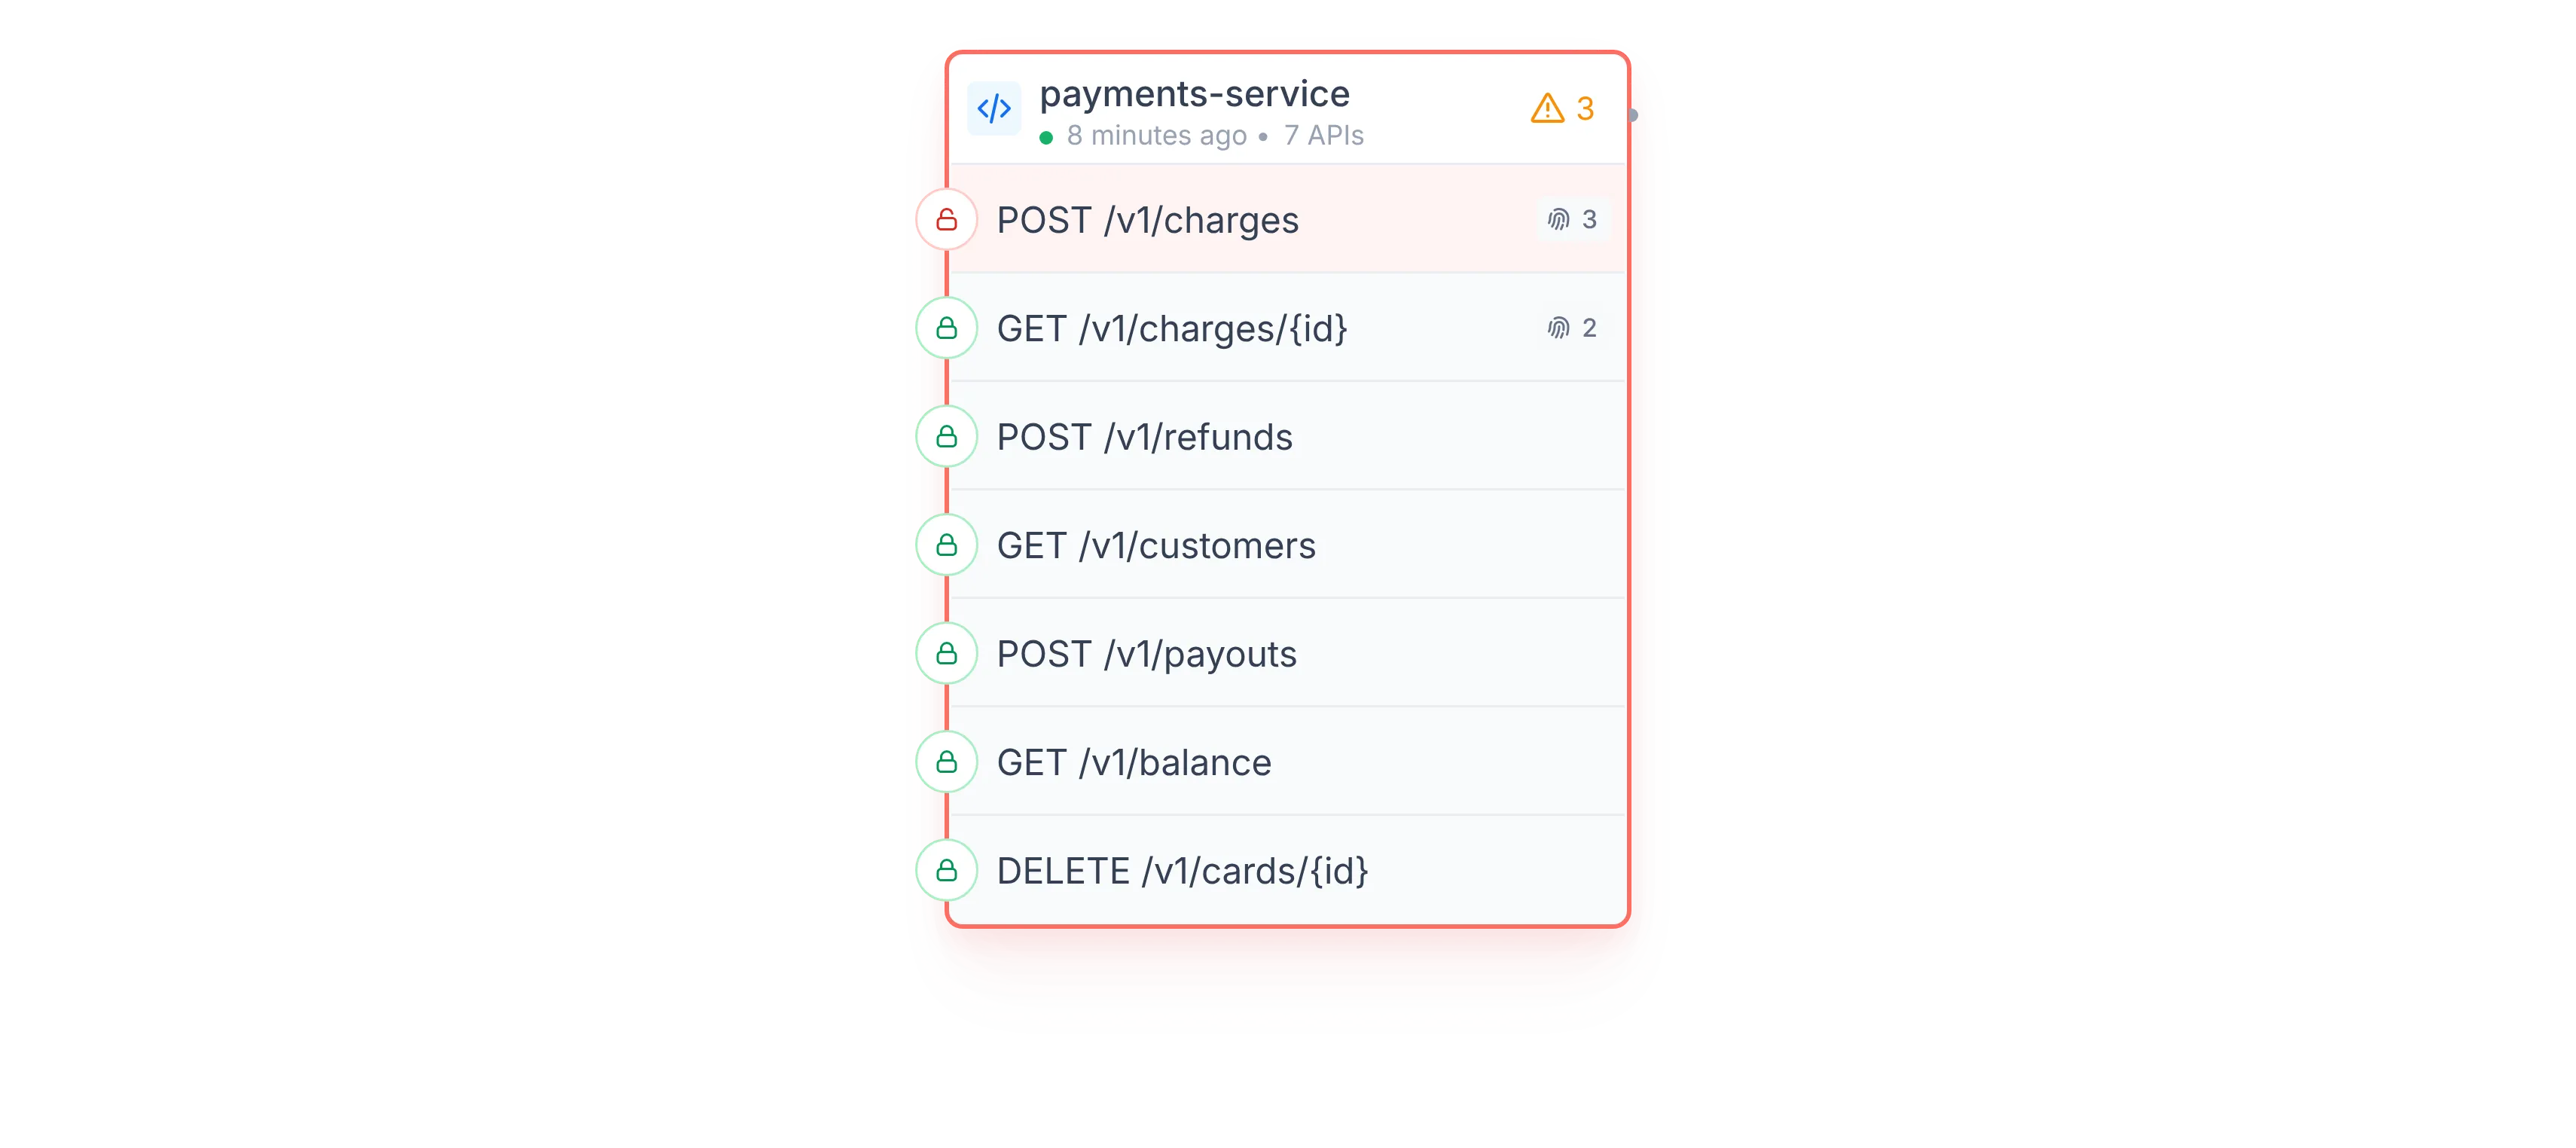
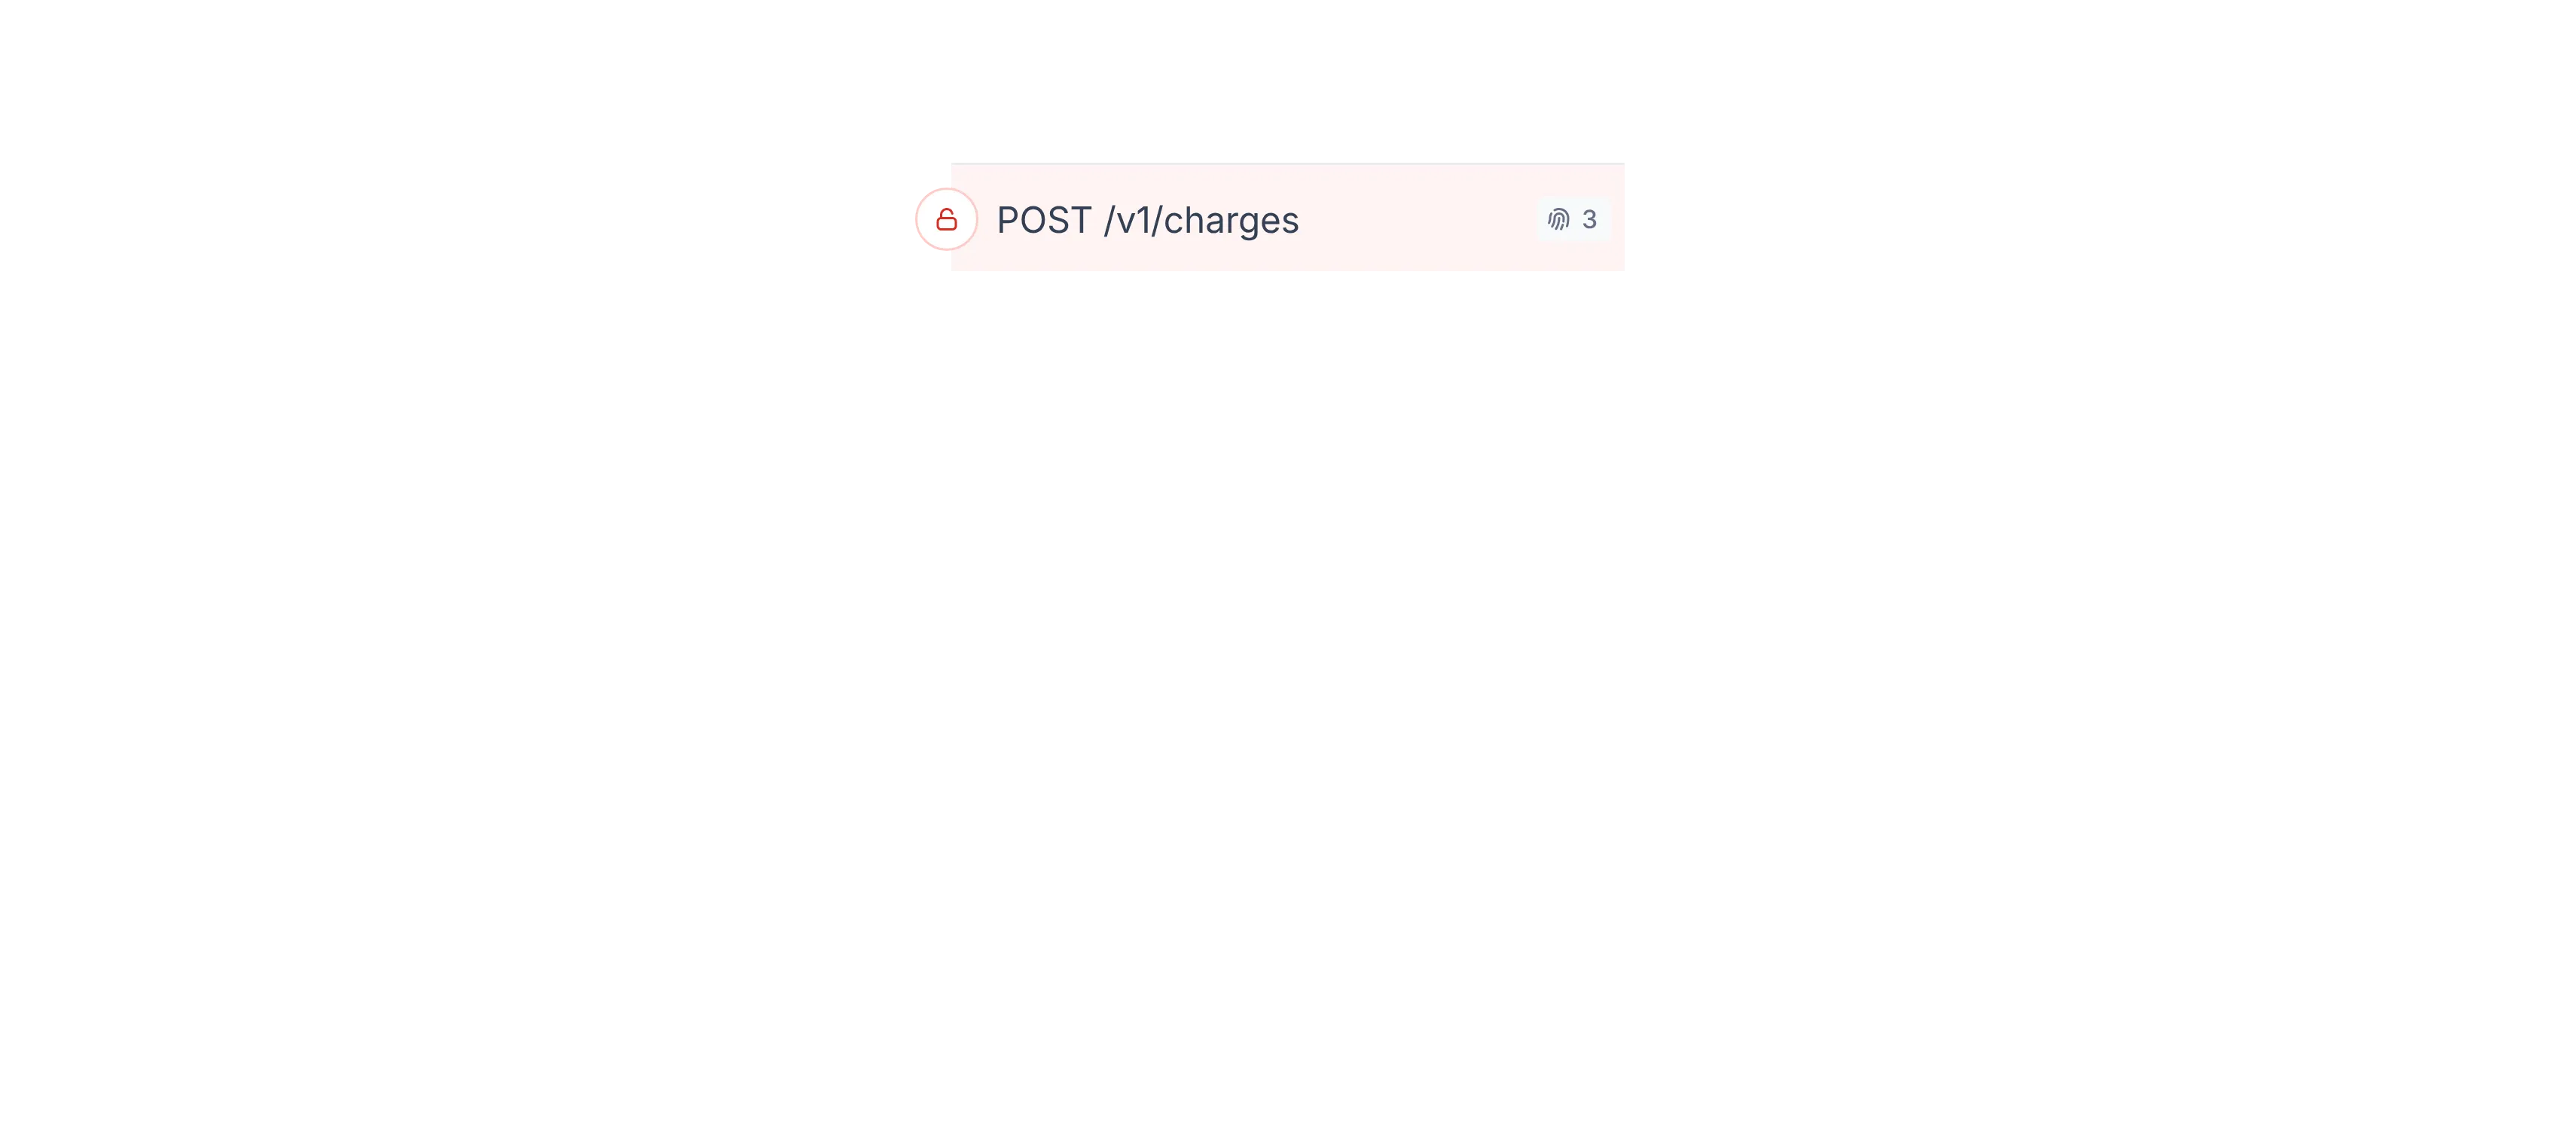
- The issueThe API where it was detected, in red
- The component and its APIsEach API with encryption, endpoints and data types
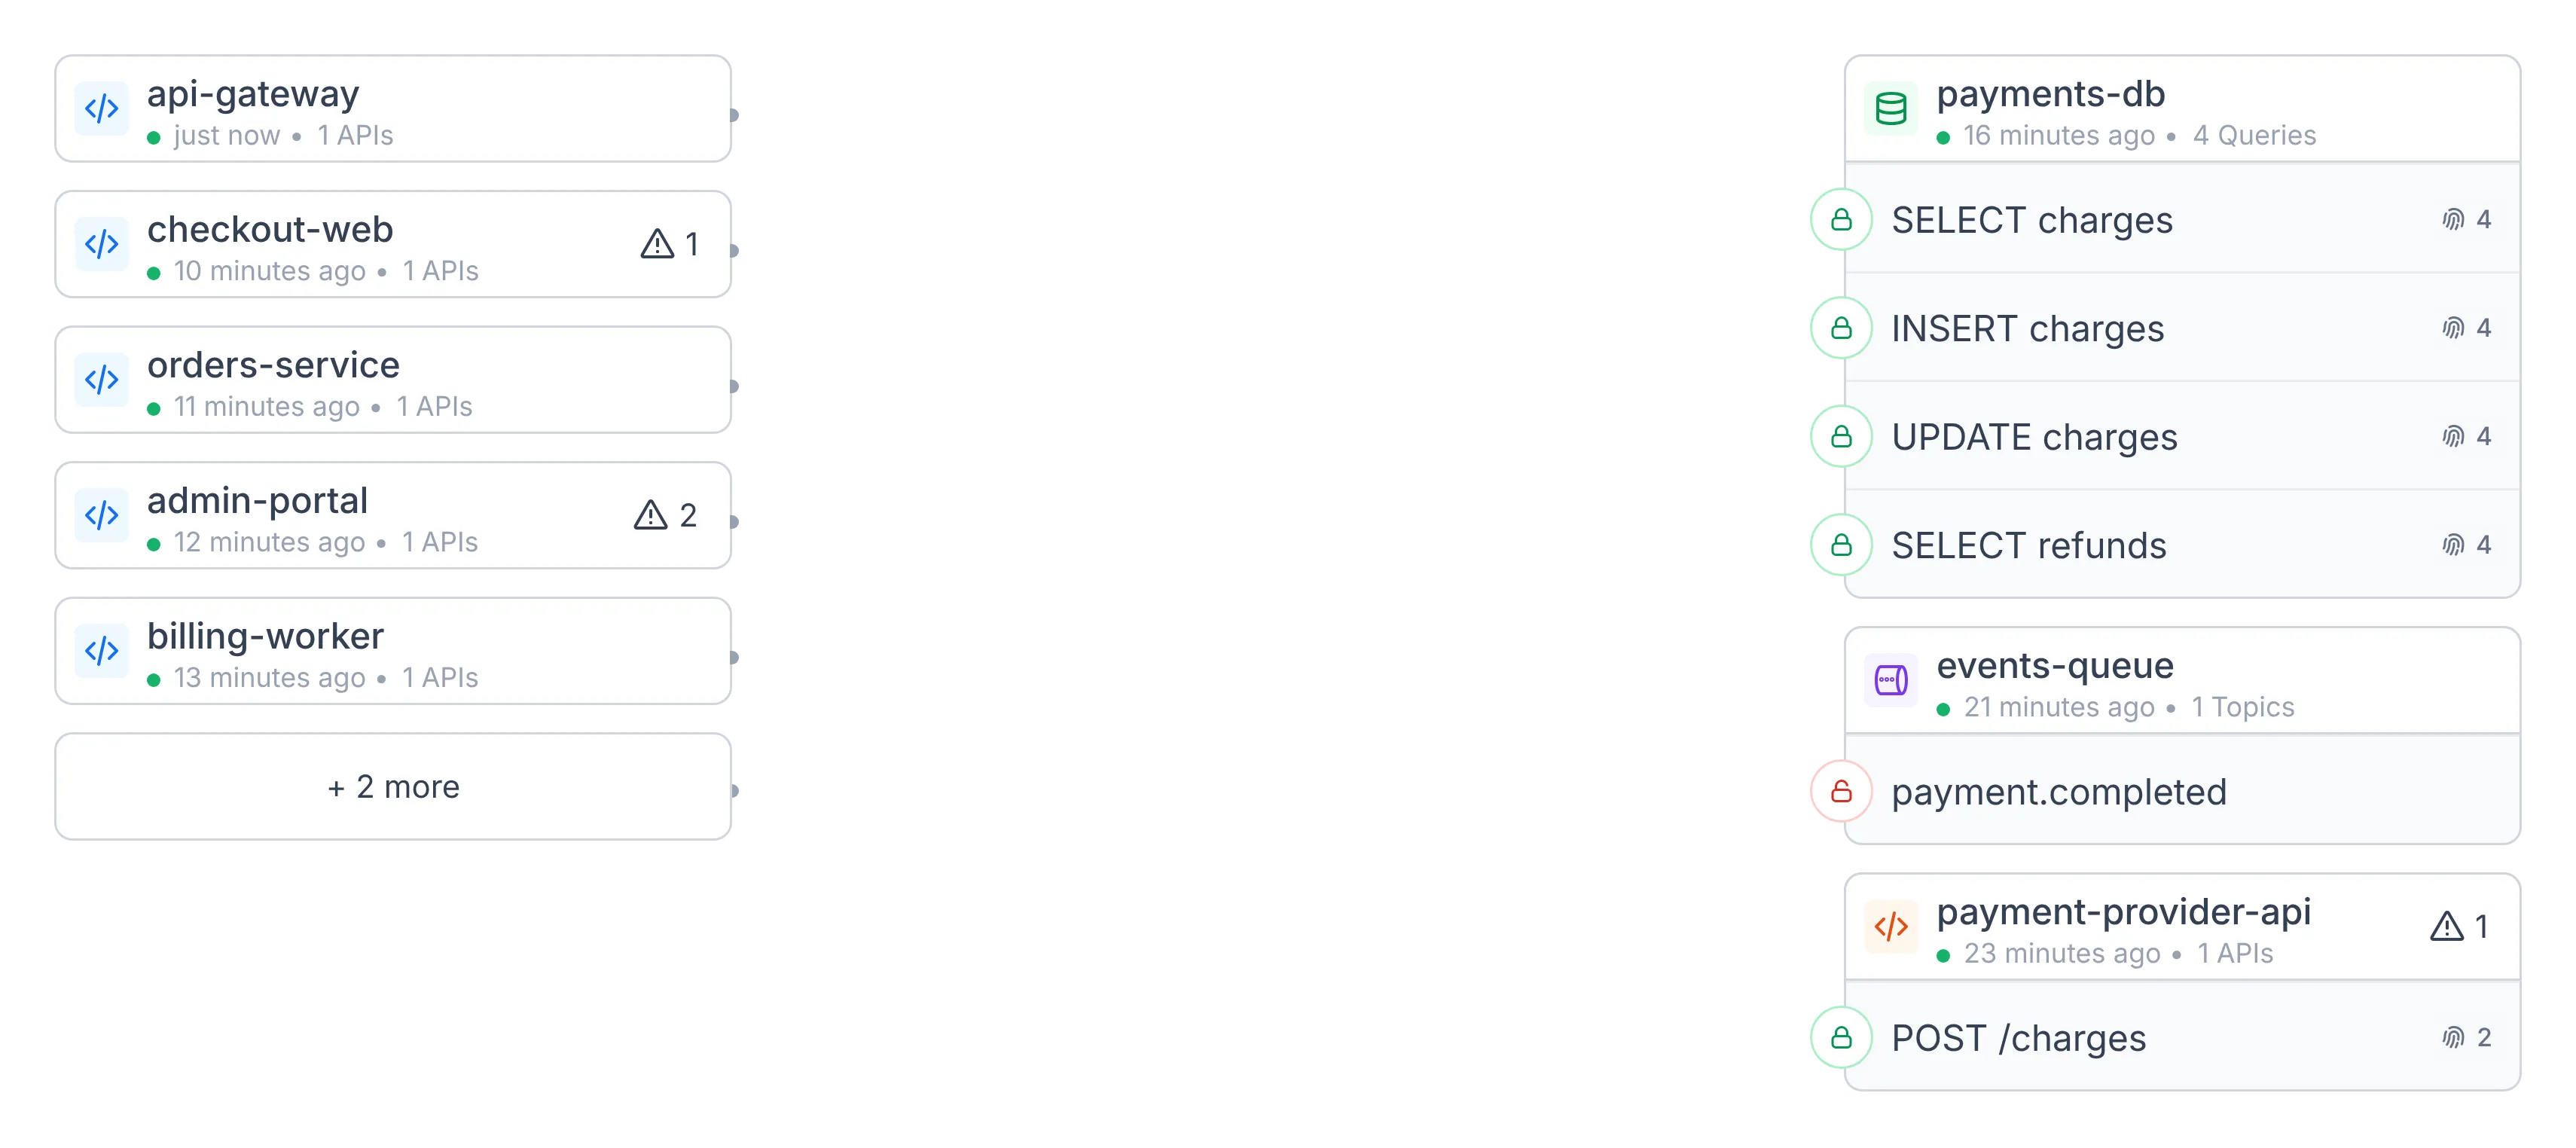
- Callers and dependenciesWho calls the component (left) and what it calls (right)
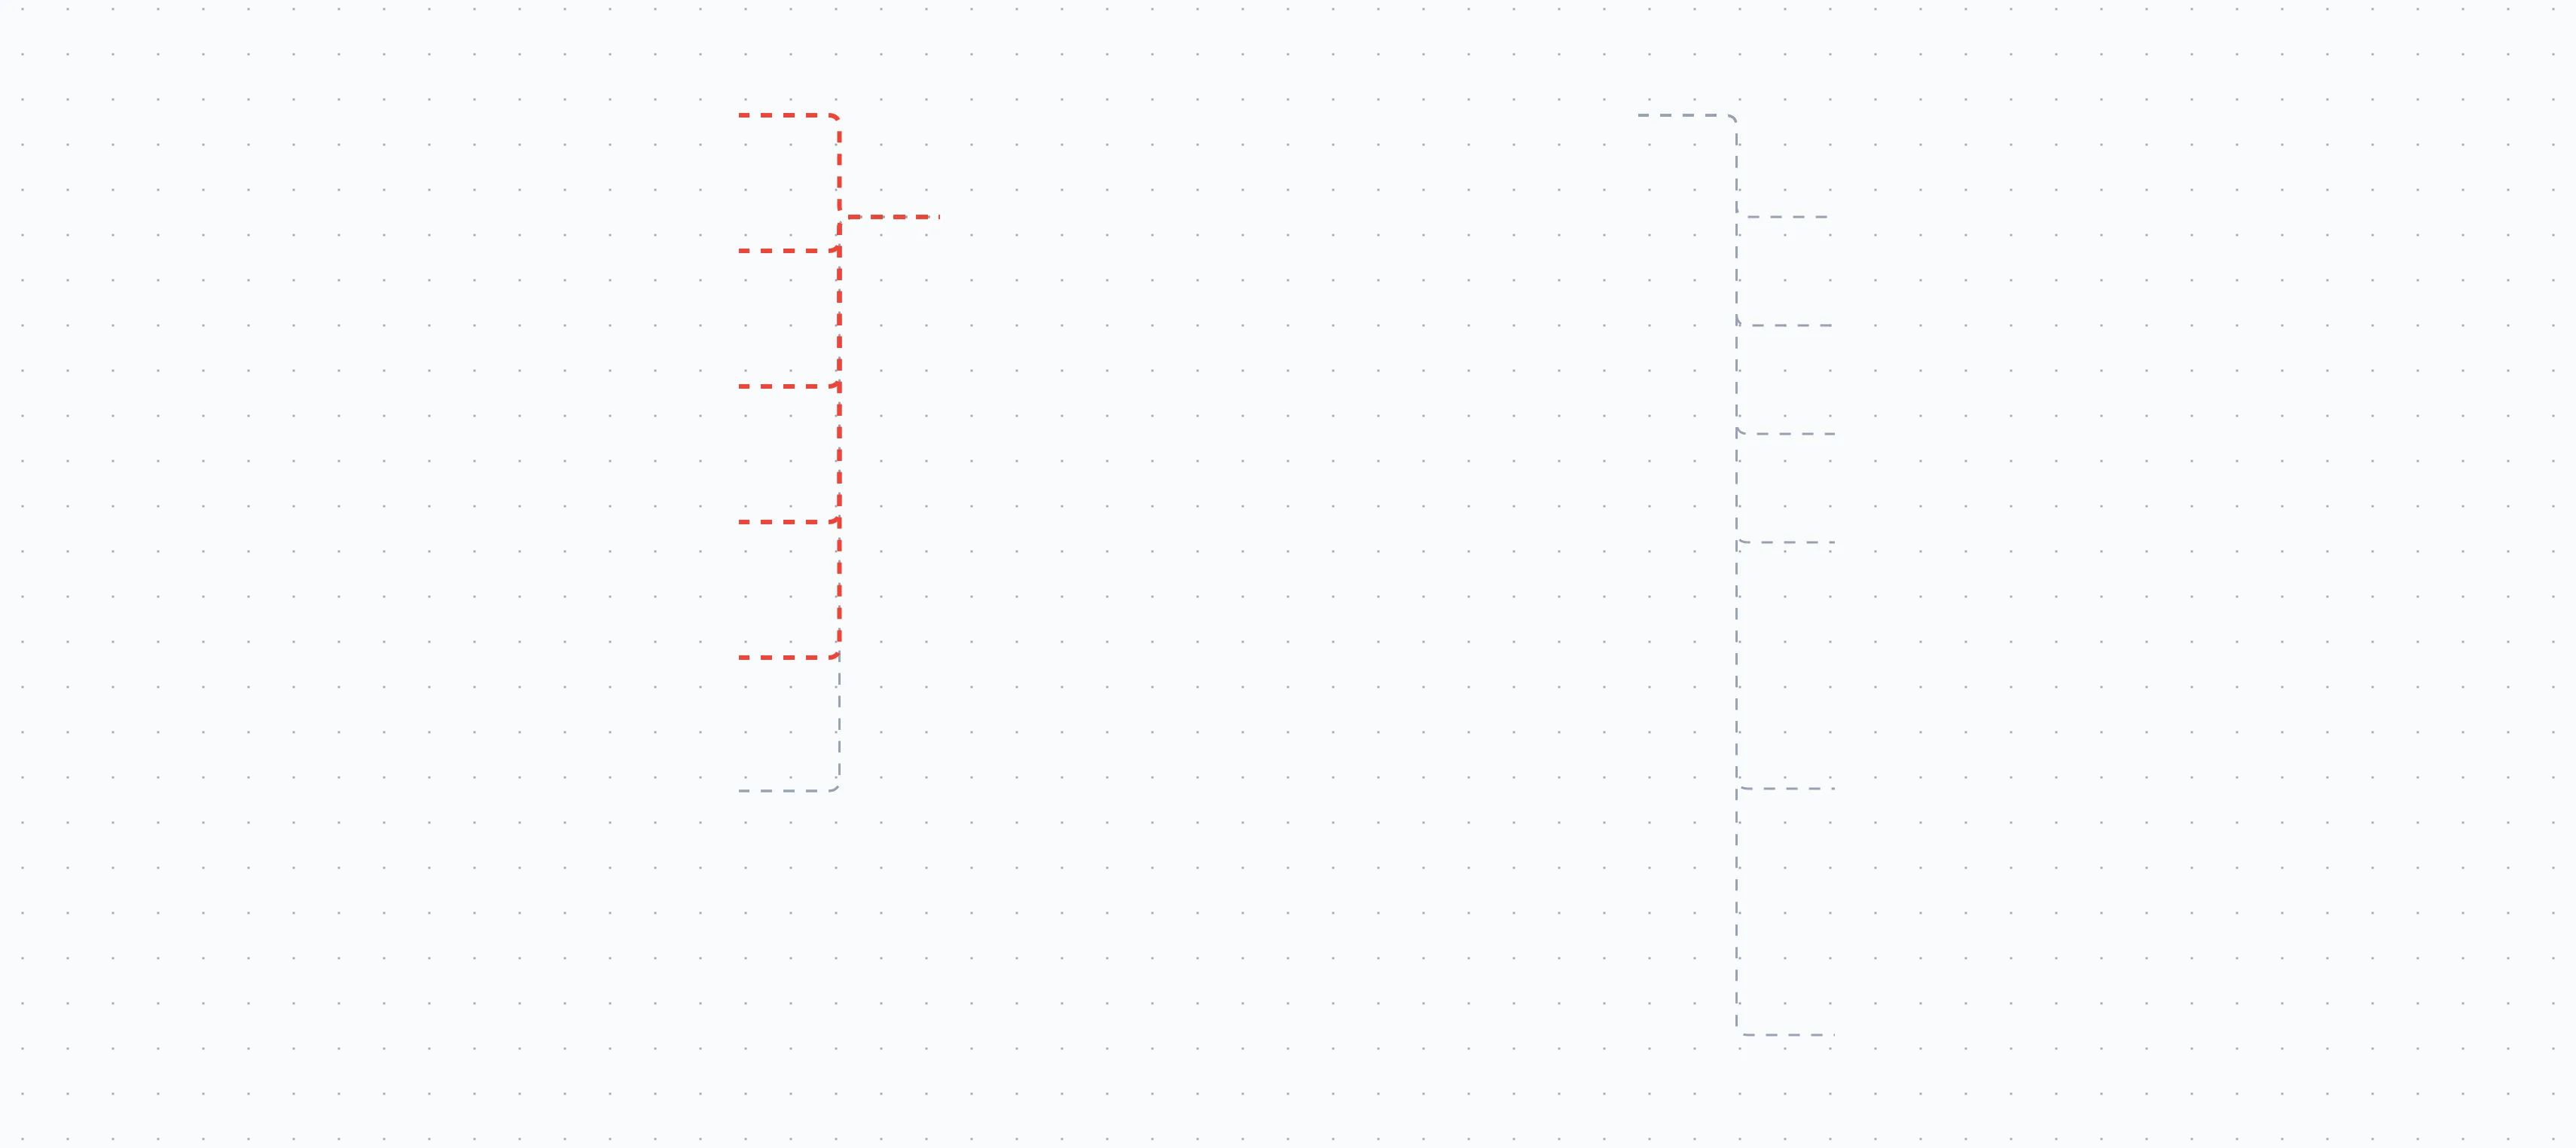
- TrafficEvery connection we saw in monitored traffic
Interactive — try it
PII exposed in API response
incident • Data exposure · PII
Latest Detection
Oct 21, 2026 14:32
payments-service
2 min ago • 7 APIs
POST /v1/charges
REST • 4 Endpoints
GET /v1/charges/{id}
REST • 2 Endpoints
POST /v1/refunds
REST • 3 Endpoints
api-gateway
just now
checkout-web
1 min ago
orders-service
3 min ago
admin-portal
12 min ago
payments-db
just now • 8 Queries
SELECT charges
PostgreSQL
INSERT charges
PostgreSQL
events-queue
1 min ago • 1 Topic
payment.completed
Kafka
payment-provider-api
2 min ago • 1 API
POST /charges
REST
Hover a component to trace its traffic · drag to pan
"The first time I've seen something like this."
Customers told us it was the first time they had seen their system this way, and that it helped them follow their app items and spot where the problems are, quickly. Our CEO made it part of how Alma was presented: finally something he could show potential customers and investors.
- Customers
- Could follow their app items and see where the problems are, quickly.
- Sales
- Became the screen the CEO showed to prospects and investors.
Key Learning
- Layout can carry meaning: left to right reads as the direction of traffic, so the map needs no legend to explain it.
- Dense systems need limits: collapsing long lists into "+ more" kept the map readable on components with dozens of connections.
- Each small signal is a piece of a bigger puzzle. A red lock or a red row means little alone; together they show the whole picture of where the risk is.
- A map is only as honest as its data. Duplicate workloads and load balancers posing as services had to be fixed before any design could work.