Endpoint View Page
- New Endpoint View
- Product
- DevSecOps · Engineers
- Users
- 2 Days
- Timeline
- Me · PM
- Team
Project Overview
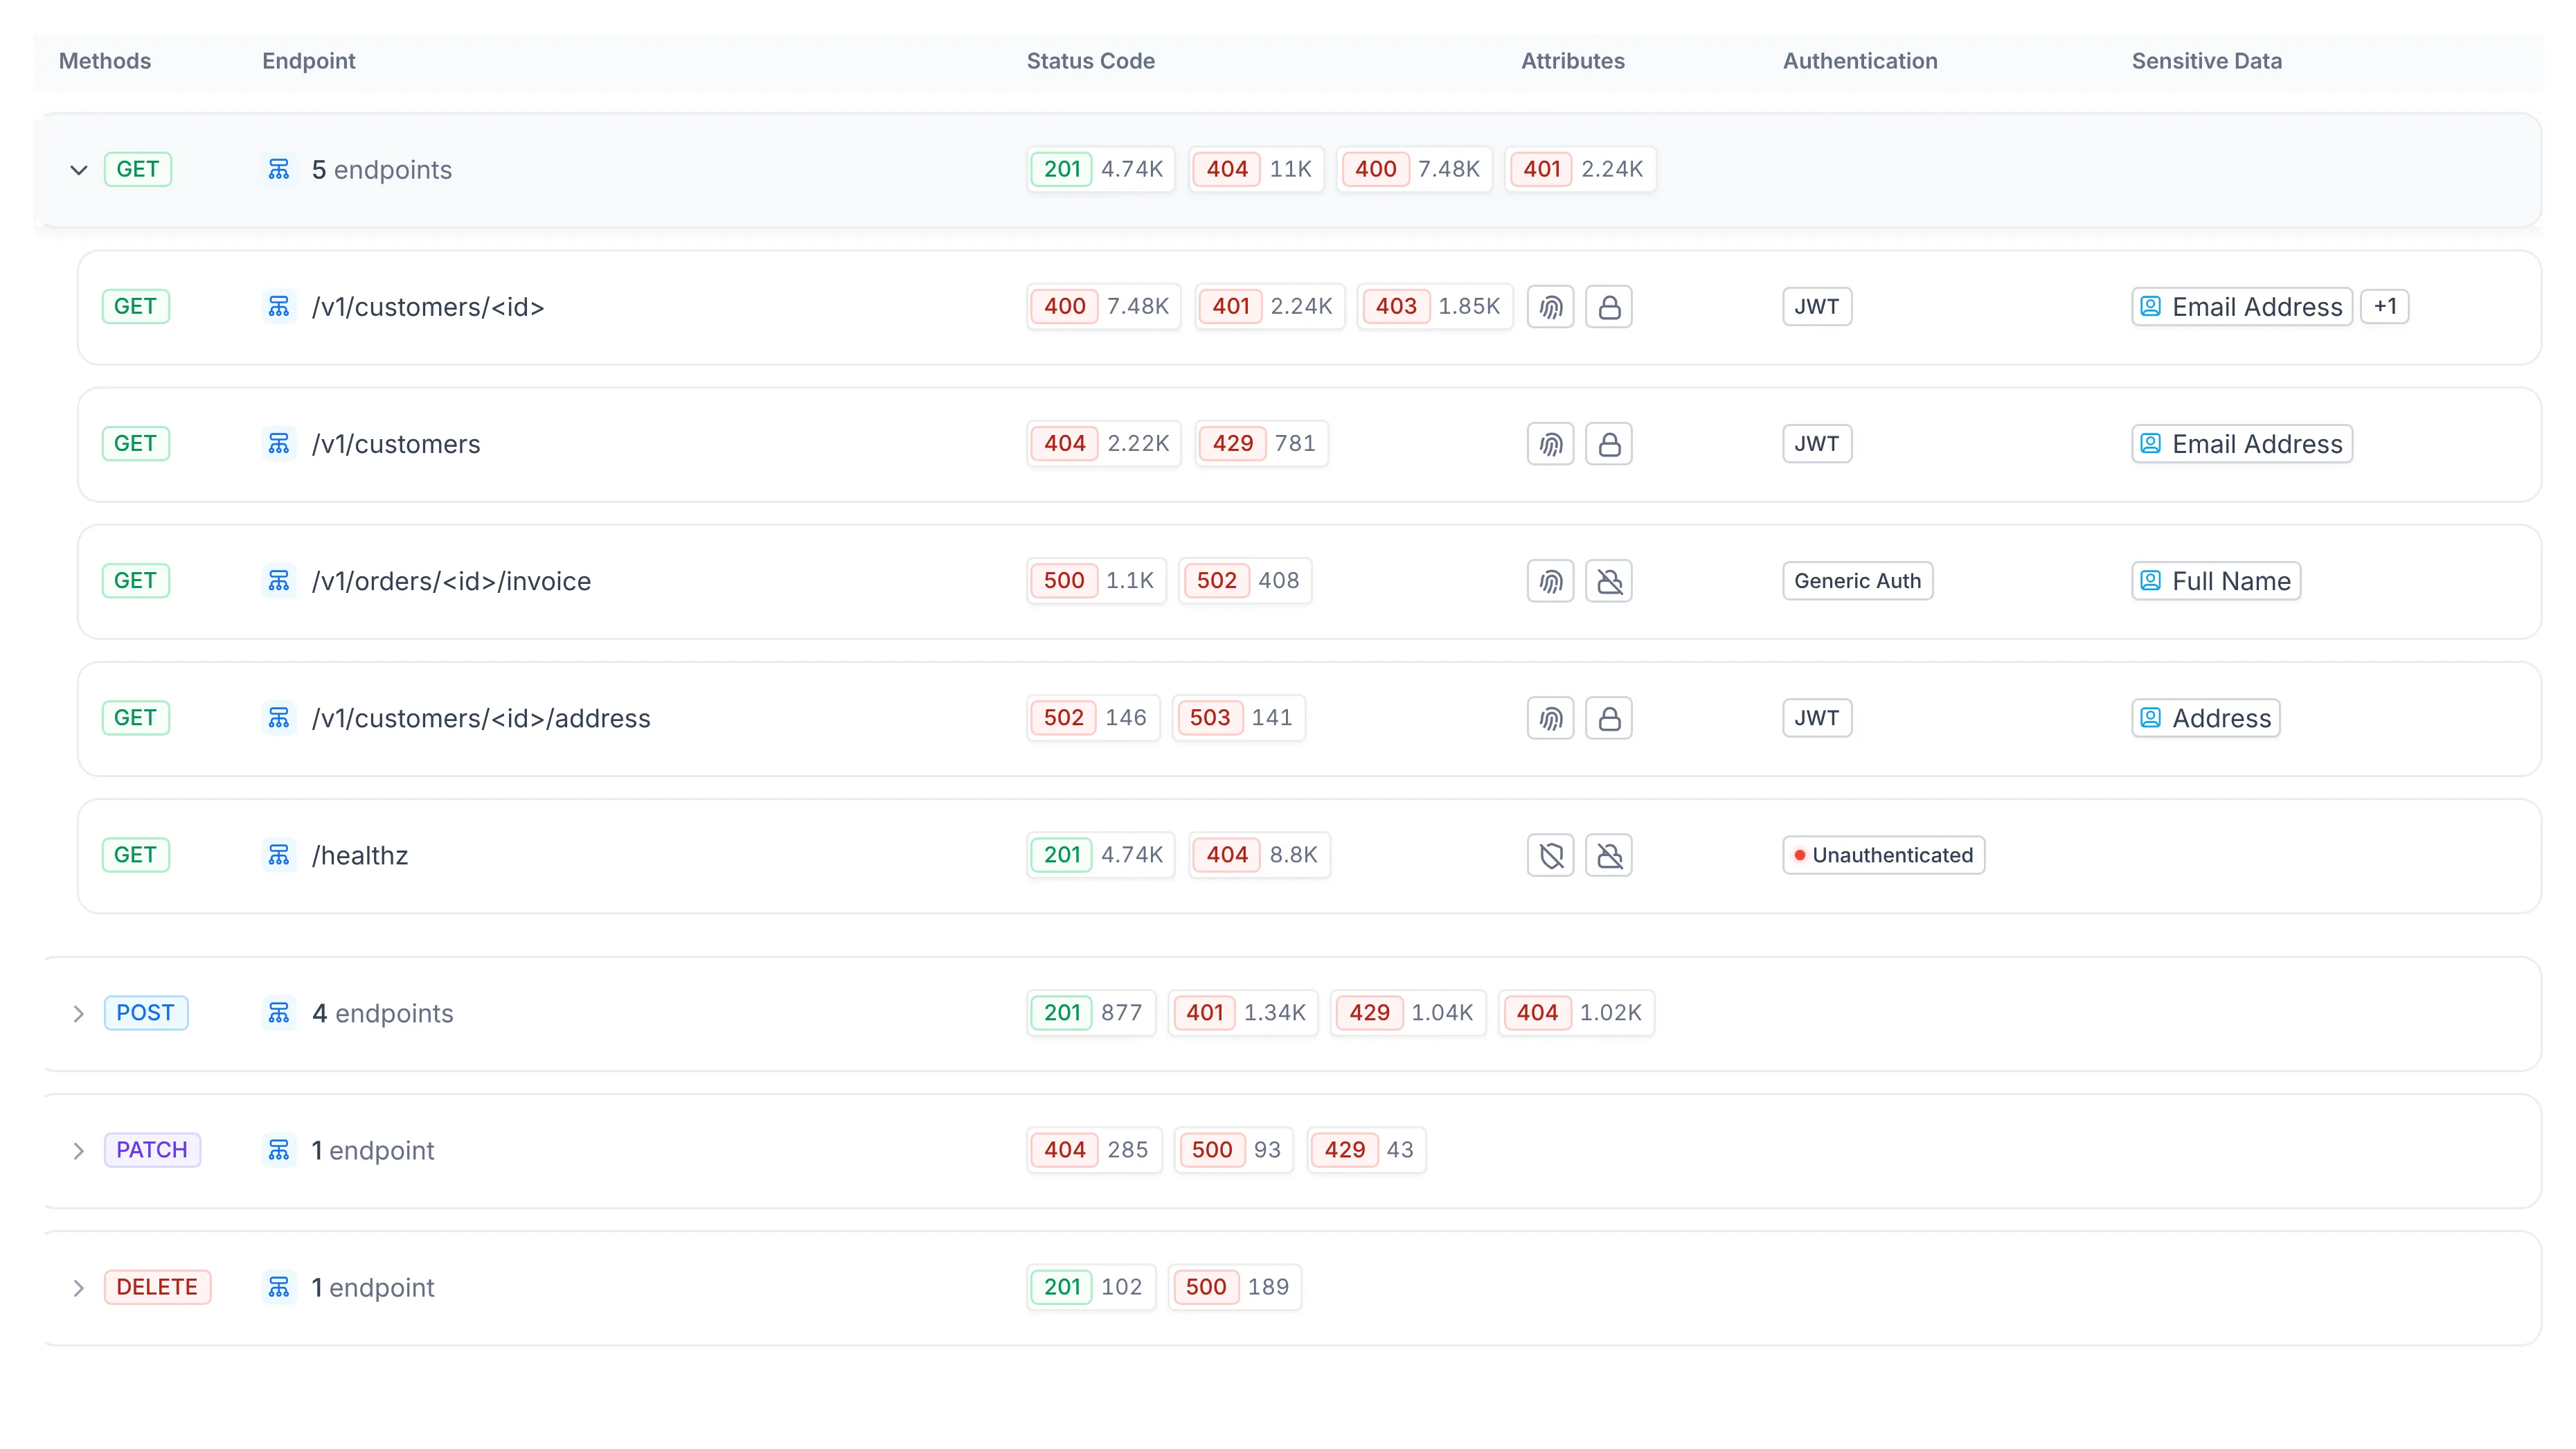
The Endpoint screen is where analysts inspect a component's APIs, every endpoint, method, status code, authentication type, and sensitive data finding. The original view paginated the data across page after page, so understanding a single service meant clicking through to page 2, 3, and beyond, and sorting or filtering only ever applied to the page you were on. I redesigned it around method-level aggregation so the entire dataset lives in one view, with full sort and filter across all of it and a complete Overview dashboard for any endpoint a user drills into.
I identified the problem myself and designed the full screen, aggregation model, status segmentation, and the endpoint detail view.
Using the product, I kept hitting the same wall: the endpoint list was technically complete but practically unreadable. I took it on as a self-initiated project, defining the aggregation logic, designing the inline status-code breakdown, and rebuilding the per-endpoint detail into a posture-first dashboard.
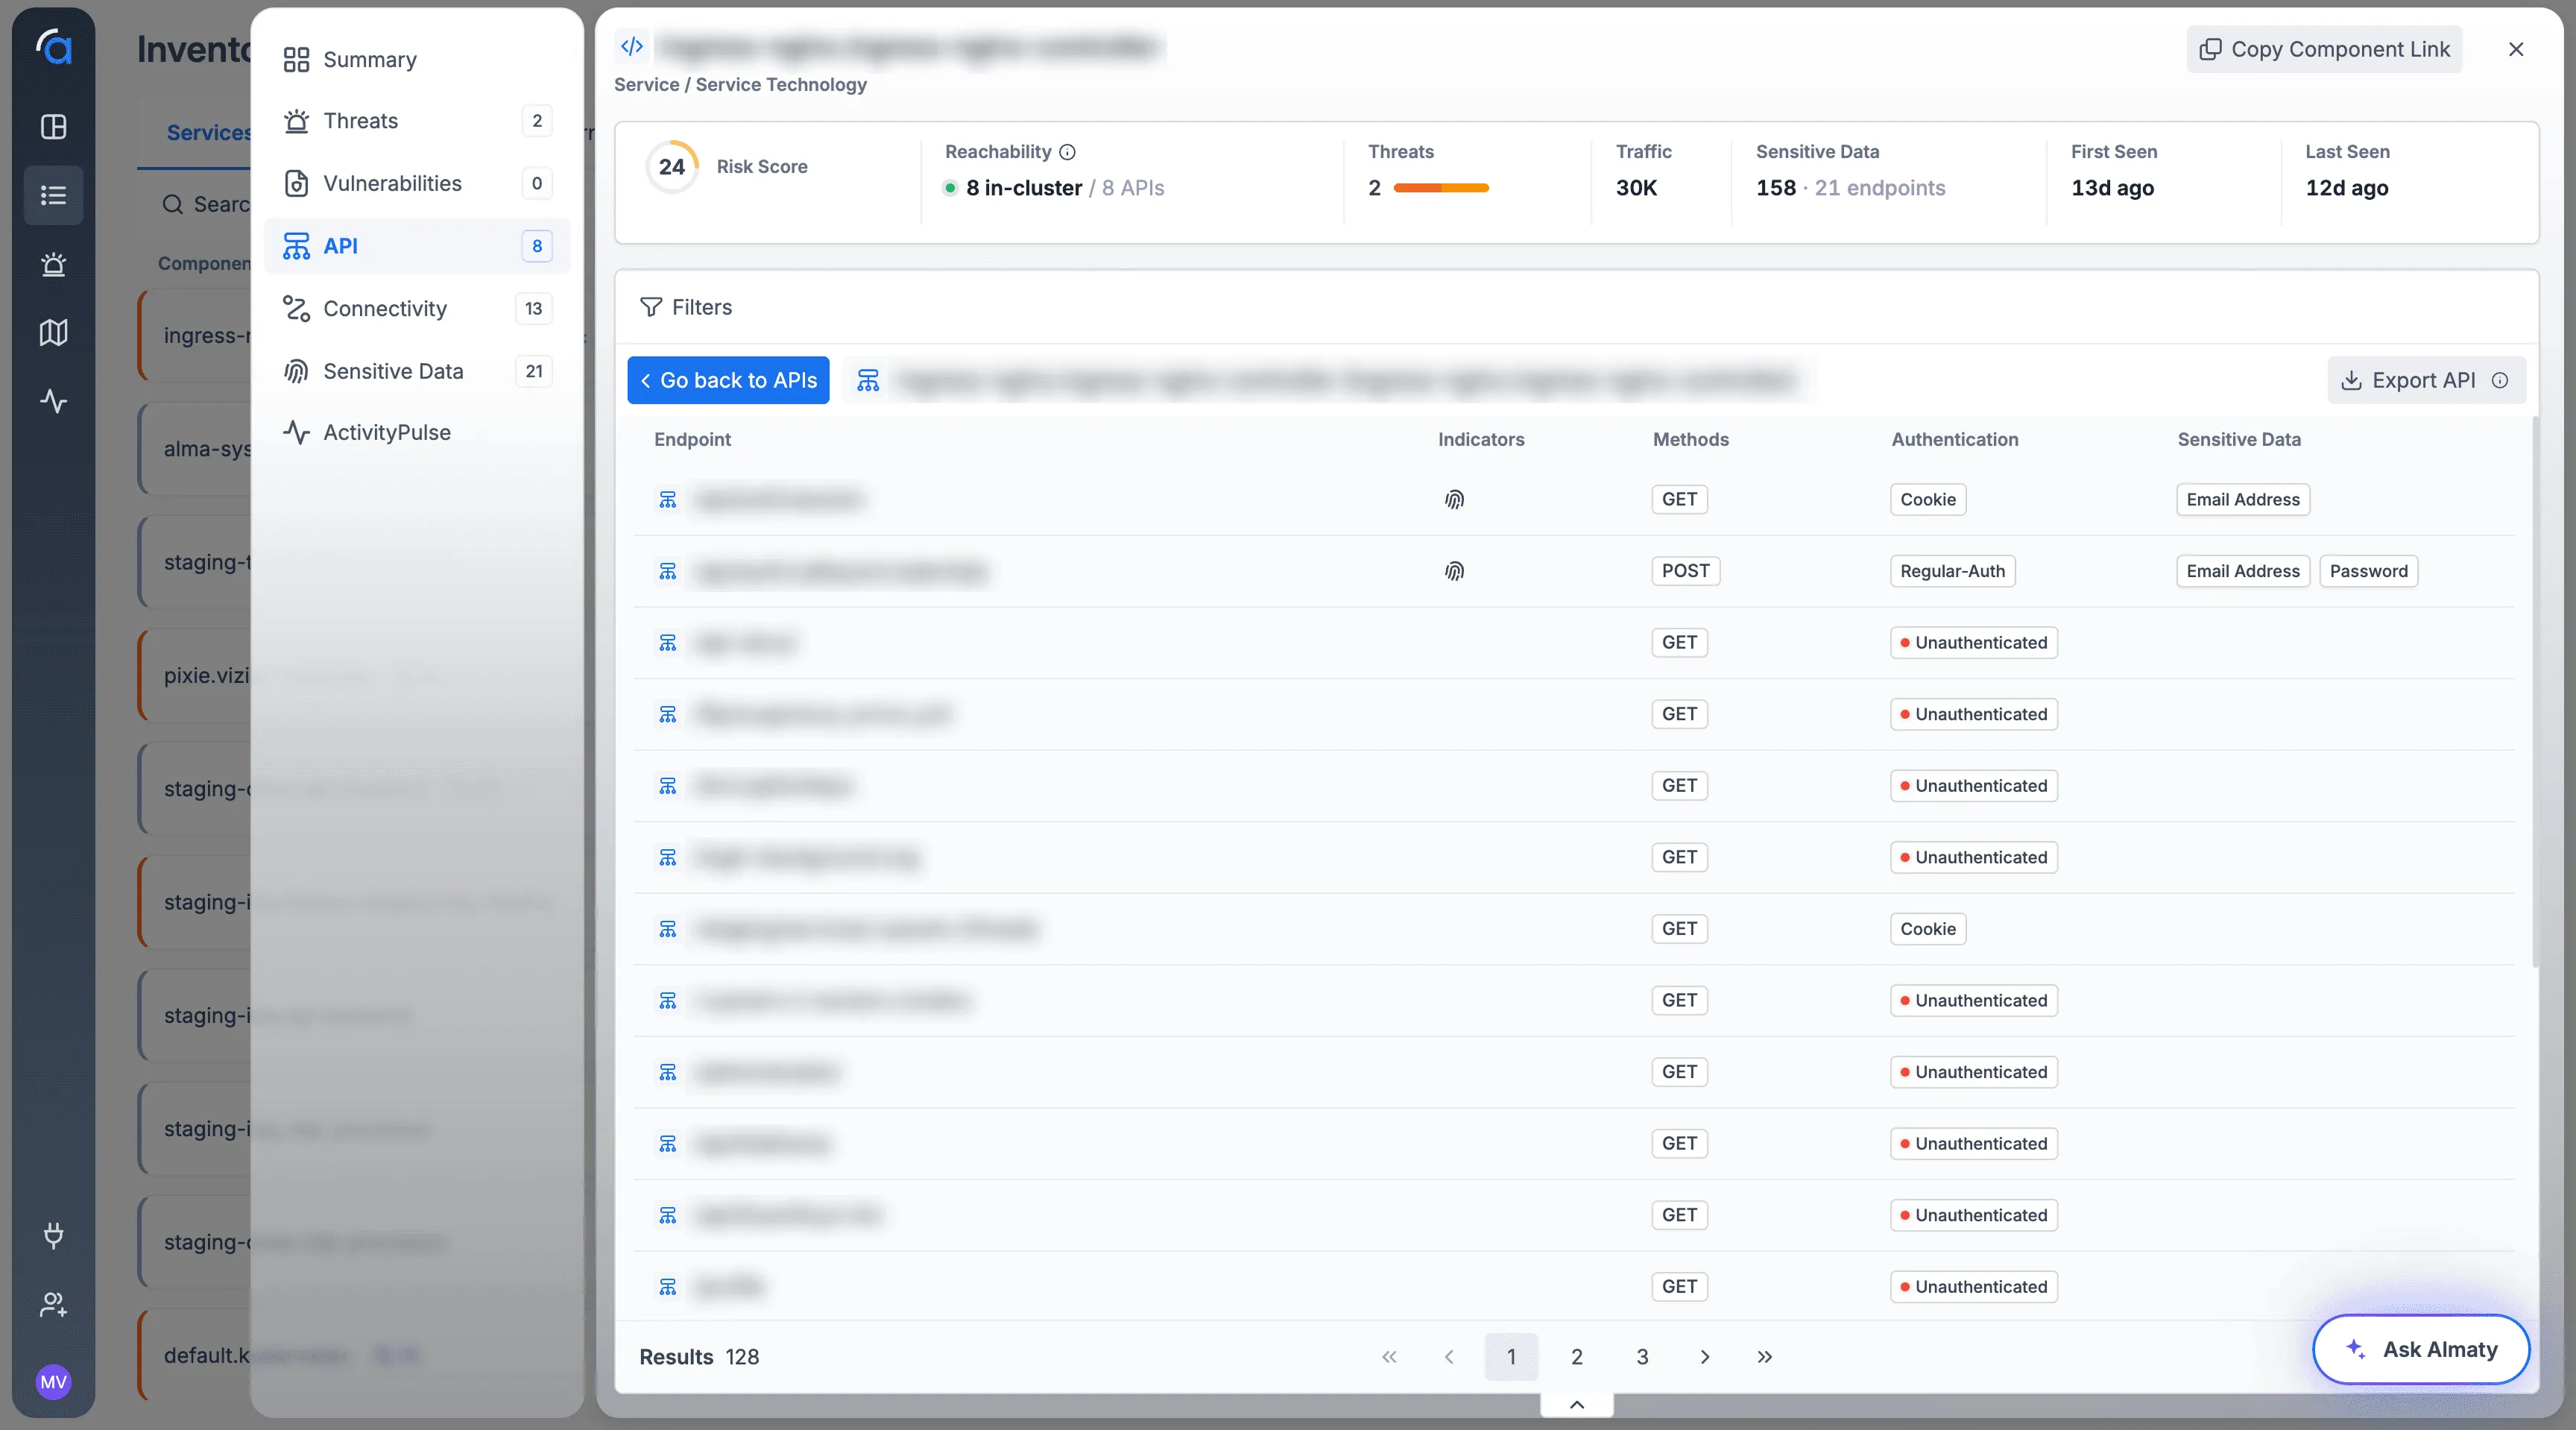
Every endpoint was its own row, so understanding a single service meant scrolling through over a hundred of them.
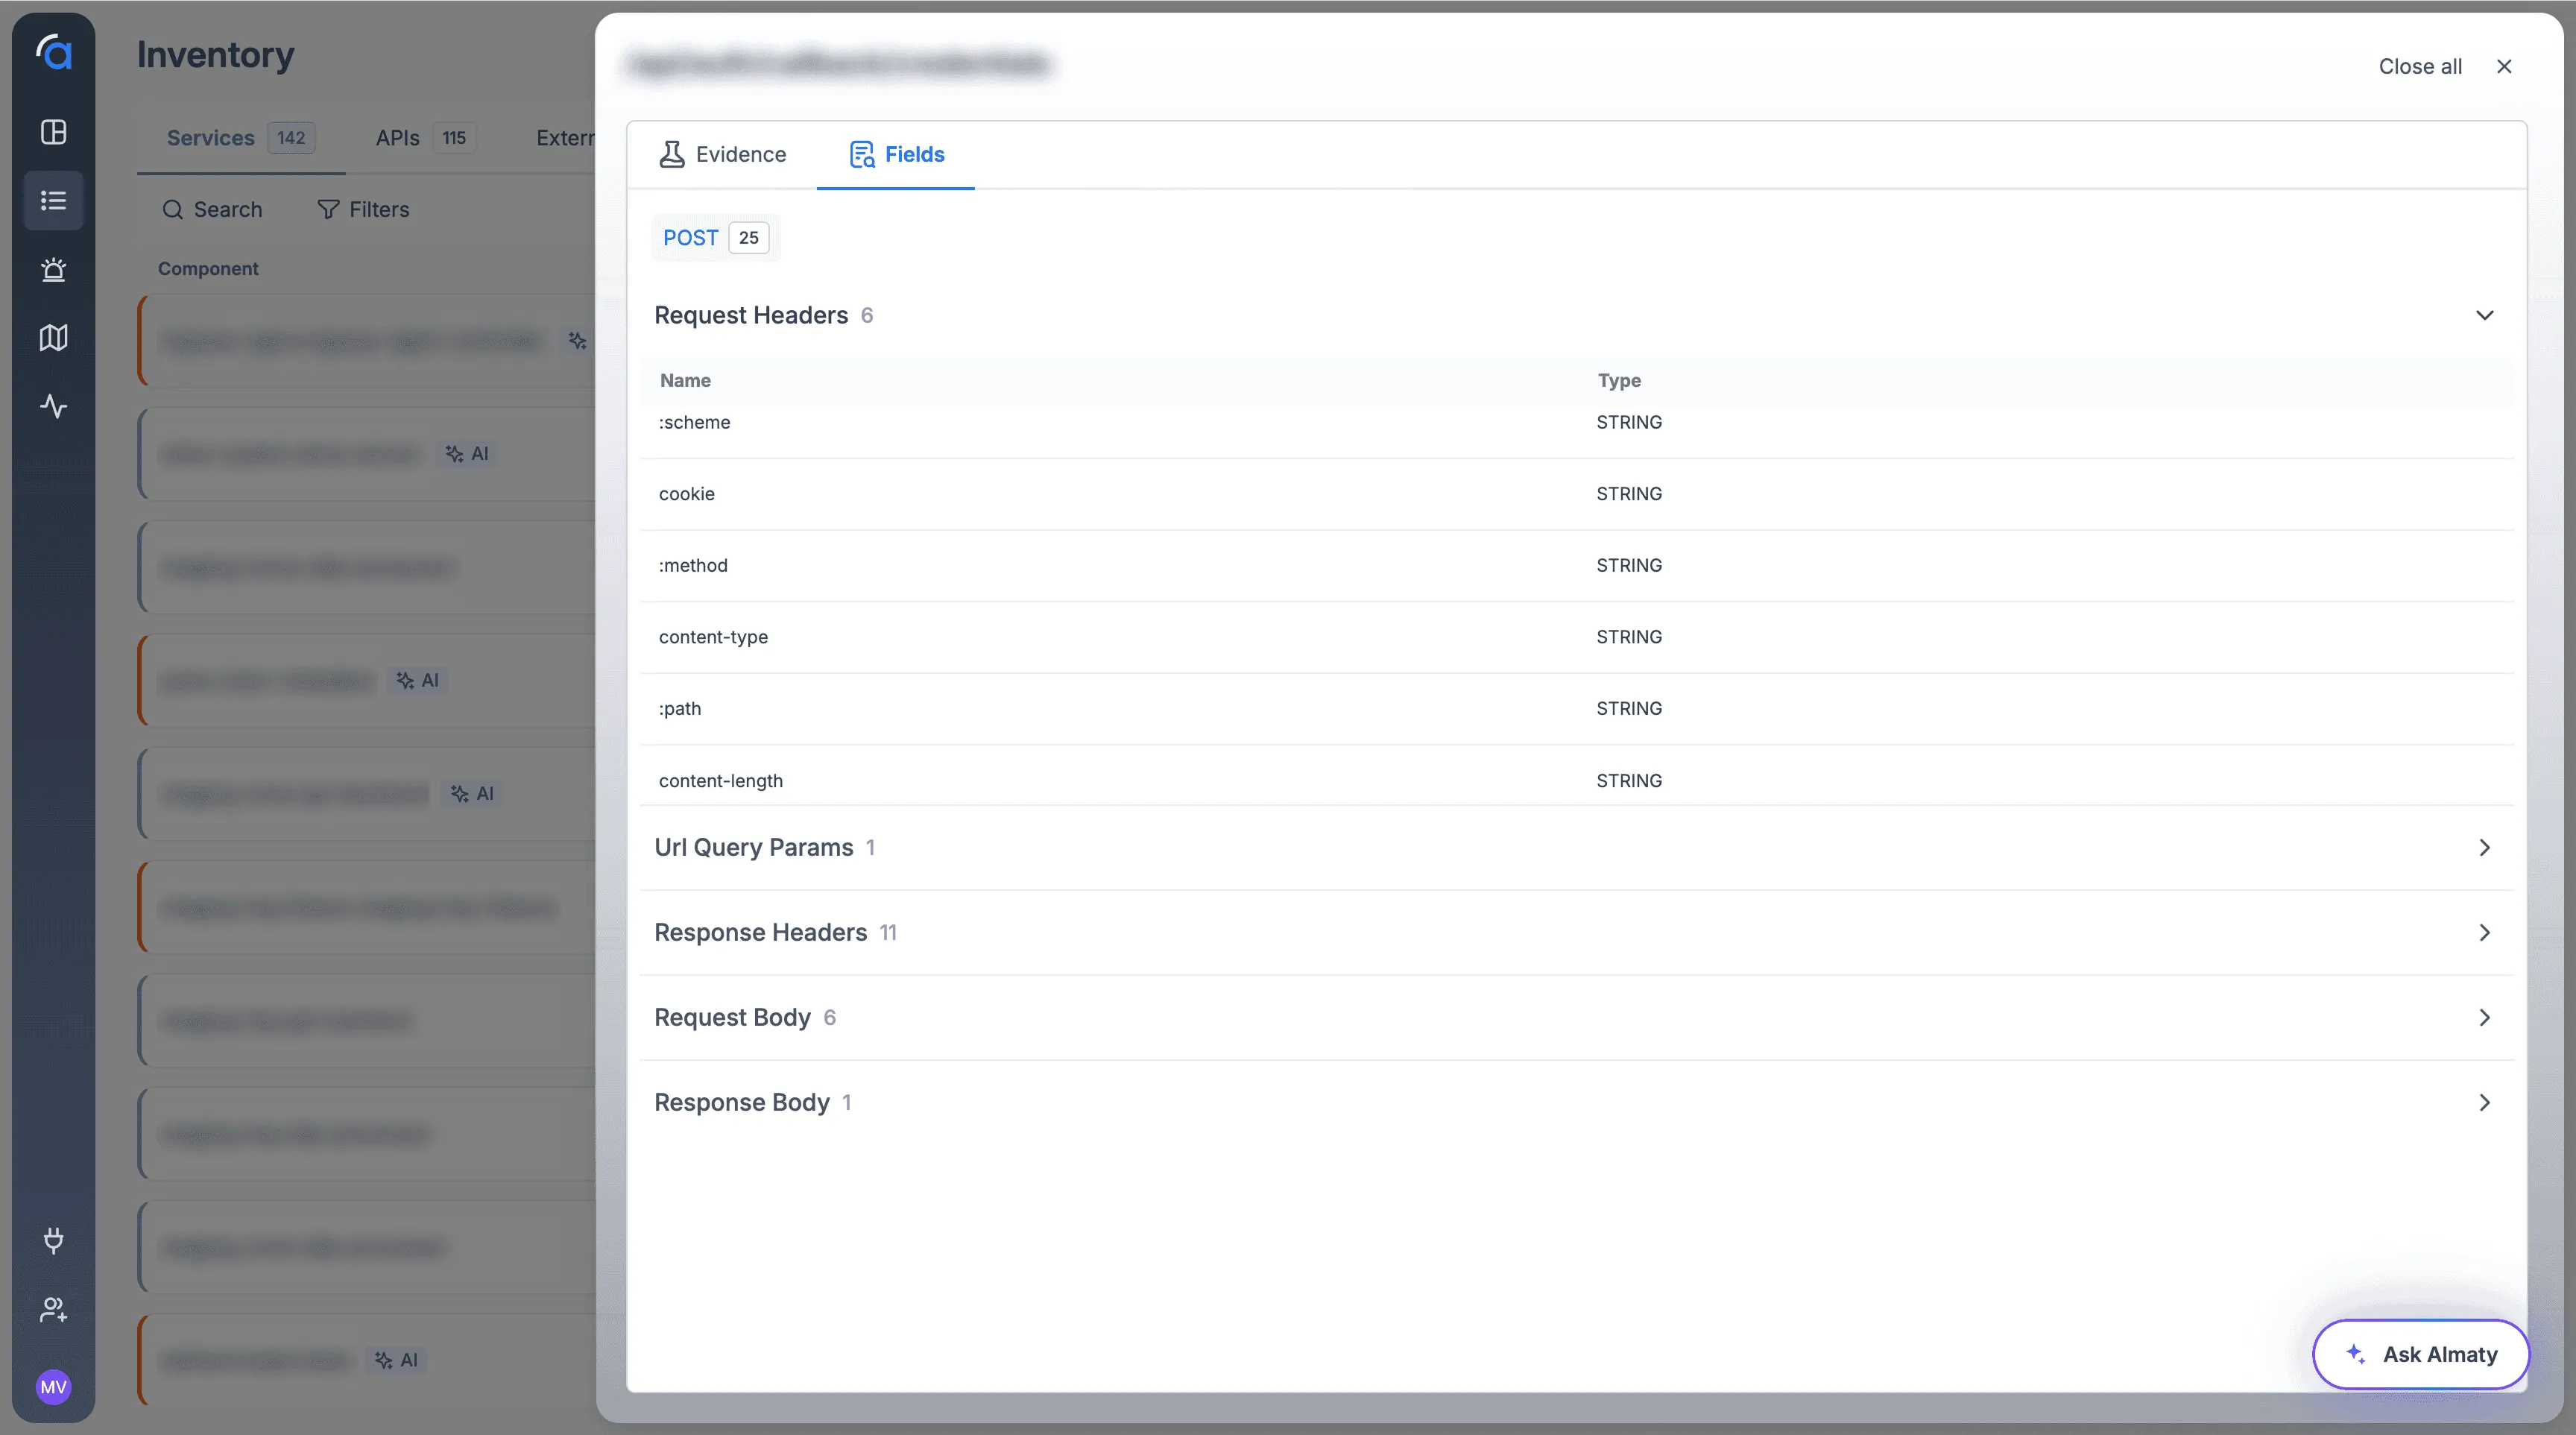
The original Endpoint screen listed each endpoint as an individual row with one method, one authentication type, and one sensitive data tag. A service with 128 endpoints meant 128 rows across multiple pages. There was no grouping, no sense of how a method behaved across endpoints, and no way to see status-code distribution without opening each one. The endpoint detail view didn't help either, it was a thin Evidence/Fields list with no posture, exposure, or consumer context.
- Pagination
- Traditional pagination created friction, making deep data analysis slow and cumbersome
- 0
- Aggregation, no method grouping, no status-code overview
- Thin
- Endpoint detail, fields only, no posture, exposure, or consumers
I mapped how analysts actually read an endpoint list, method first, then behavior, then the specific path.
Watching how analysts approached the screen, the pattern was clear: nobody reads endpoints alphabetically. They think in terms of "what are all the POSTs doing?" or "which endpoints are returning errors?" Method and status code were the real entry points, but the design forced them to scan individual rows to reconstruct that picture manually. The redesign needed to surface those dimensions first.
- 1 view
- all endpoints in one placeת no pagination, even at scale
- 3
- Levels defined: method group → status segmentation → endpoint detail
- 6
- Posture dimensions surfaced in the new endpoint detail view
Design Opportunity
How might we put every endpoint in one view, sortable and filterable across the whole set, no pagination, so analysts see method behavior, status distribution, and sensitive data at a glance, with full per-endpoint detail one click away?
Method-aggregated rows, inline status segmentation, expandable endpoints, and a posture-first detail view.
128rows for a single service
128 endpoints meant 128 rows.
The original screen gave every endpoint its own row, split across pages. Sorting and filtering only applied to the page in view, so nobody could answer a question about the whole service.
Opening one told you almost nothing.
The endpoint detail was a thin Evidence/Fields list. No posture, no exposure, no idea who was calling it.
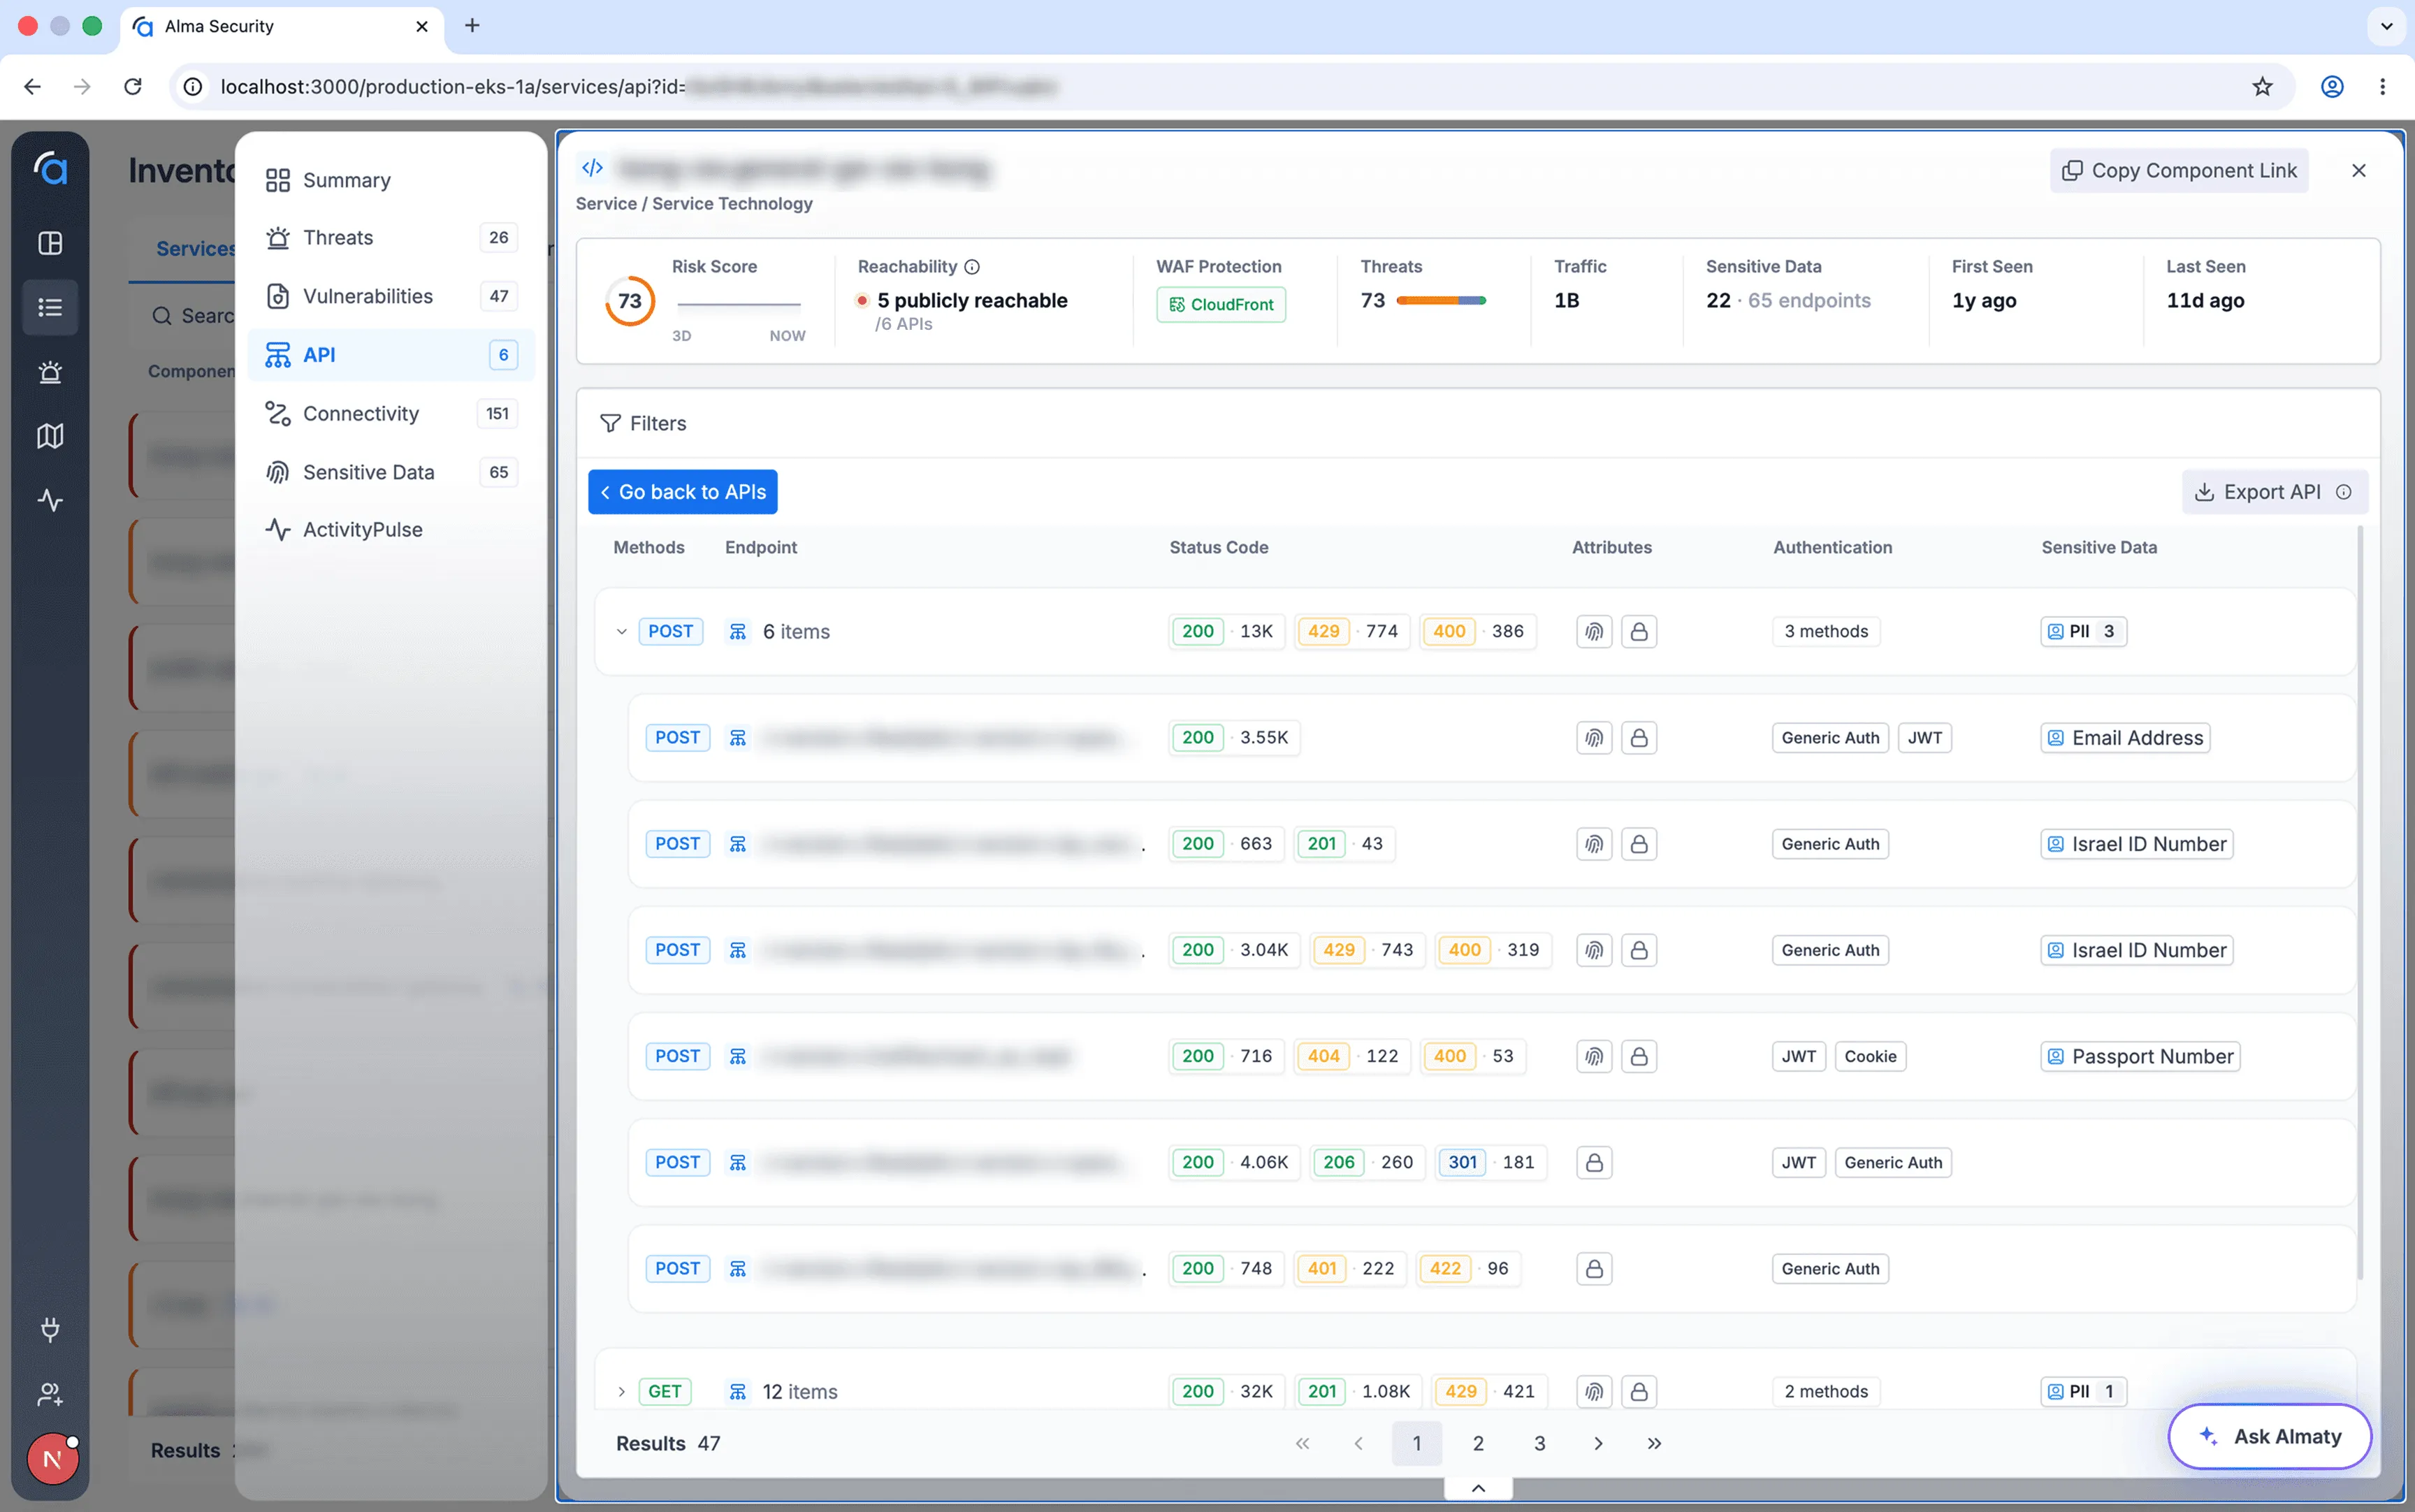
4method groups instead of pages of rows
Start where analysts start: the method.
Nobody reads endpoints alphabetically. Analysts ask what all the POSTs are doing, so the list now opens on one row per method with an item count, and every endpoint sits inside its group.
Show behavior before anyone expands a row.
Each group carries its status-code split inline, 200s next to 4xx and 5xx, so a spike of errors on one method is visible at a glance.
1view for all endpoints, no pagination
Every endpoint in one view, at any scale.
No pagination, so sorting and filtering finally work across the whole set: all the 4xx responses, everything unauthenticated, every endpoint touching sensitive data.
6posture dimensions in the detail view
Then the full picture of one endpoint.
Any endpoint opens into a posture-first detail view: identity and exposure, runtime posture, findings on the parent API, sensitive fields, data shape and who consumes it.
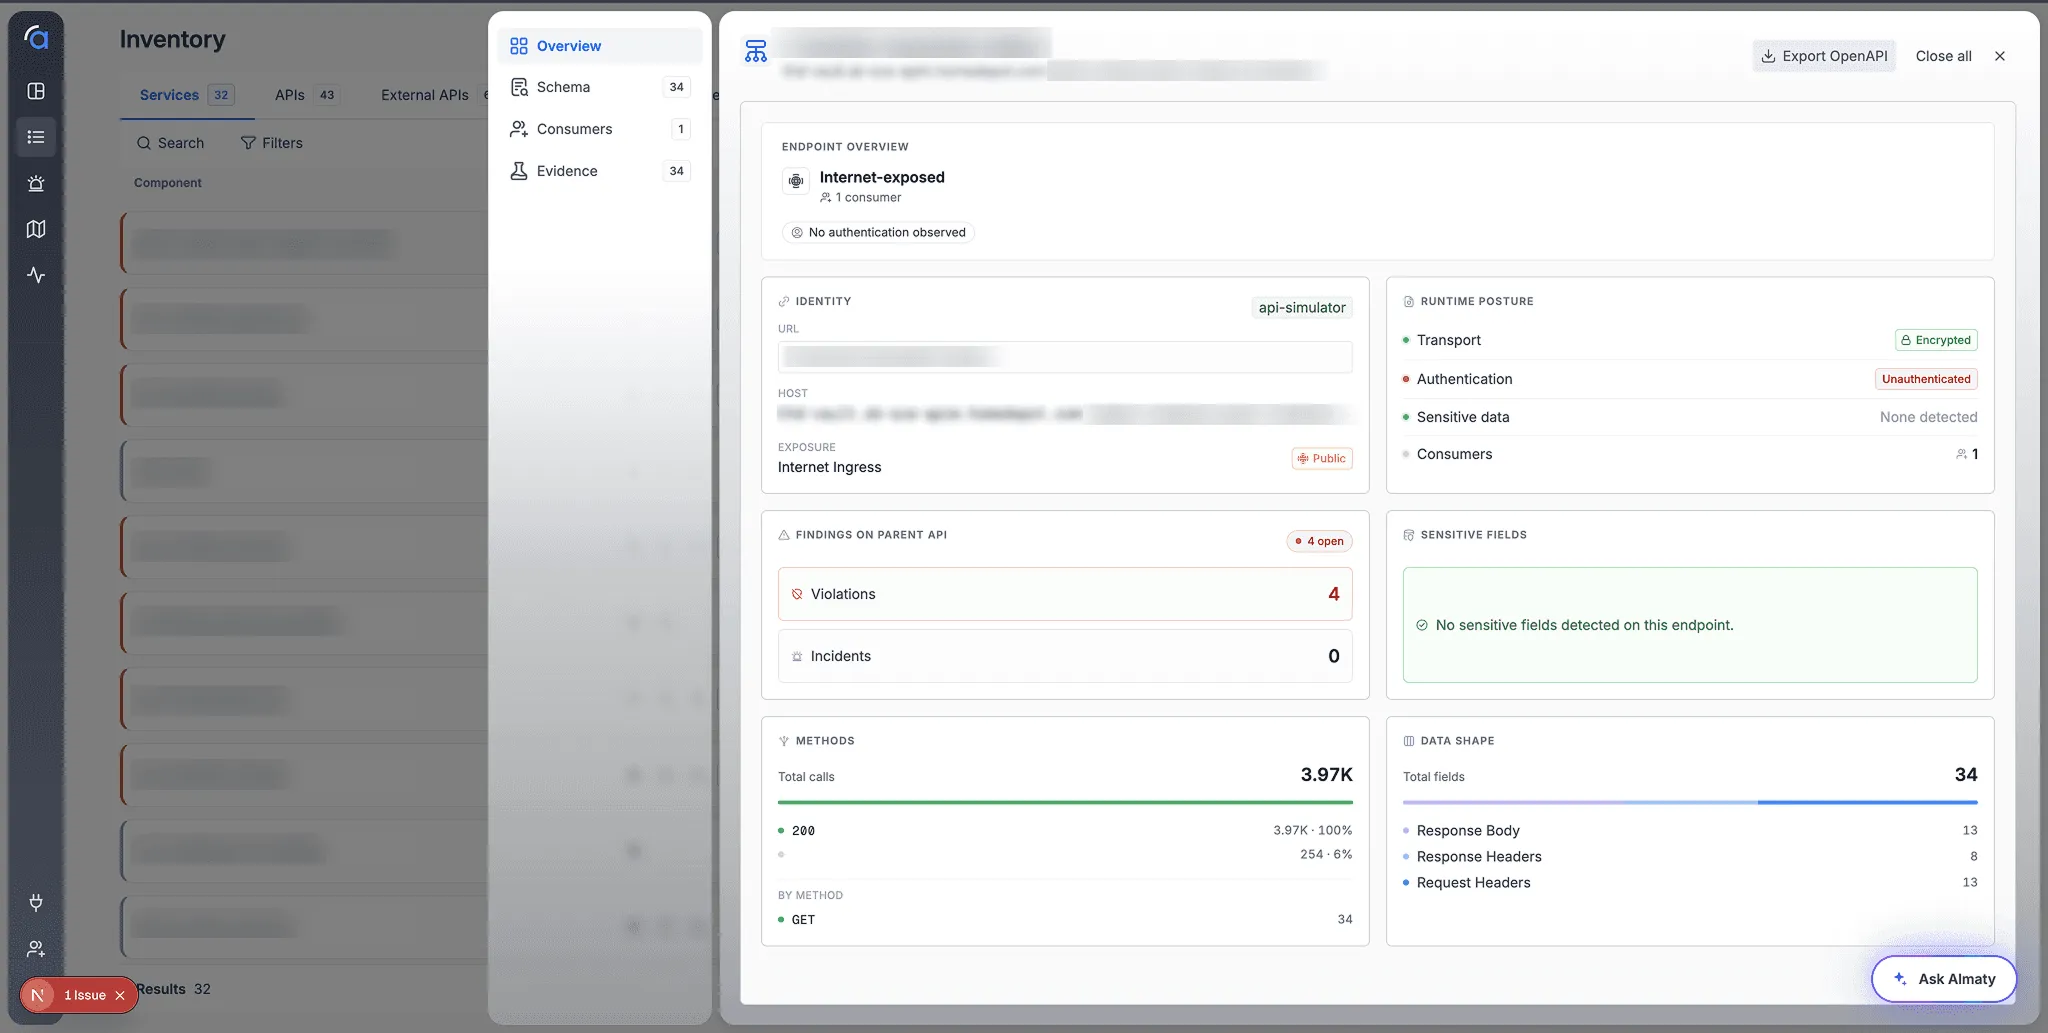

Analysts can now read a service's endpoint behavior at a glance, and drill into full posture without leaving the view.
The redesign is in internal testing with the team. Early feedback is that the method-aggregated view fundamentally changes how fast analysts can read a service, what used to take scrolling and mental reconstruction is now visible in the first screen, with full per-endpoint posture available on demand.
- No pages
- sort and filter span all endpoints at once, not page by page
- Glance
- Status-code distribution now readable without expanding anything
- Testing
- In internal validation with the team ahead of production
Key Learning
- Splitting data across pages quietly breaks the most useful tools: sort and filter that only work on the current page aren't really sort and filter at all.
- Status code and method aren't metadata, for an analyst, they're the primary lens. Aggregating around them lets the full picture surface even at tens of thousands of rows.
- Depth and overview aren't a tradeoff. The aggregated view earns trust; the detail view earns action. A good design serves both without forcing a choice.